






Integrated lithium battery energy storage solutions
Industrial Energy Management and Production Synergy

Industrial Energy Management

Integration of production rhythms, power distribution capacity and energy management into the same energy model

Production plan changes, loads and reservoirs are able to respond in a synchronized manner to optimize demand, energy consumption costs, mountain movement and critical load safety through integrated closed loops through EMS, MES, SCADA, without compromising production rhythms.

Production
Production beats. Orders, shifts and production load movement.
Car
Horizontal management of workshops Integrated monitoring and energy consumption analysis of multiple production units.
Paul.
Process critical safeguards Prioritization of critical loads and process continuity.
Expanded
Wide-area connectivity Multi-plant, multi-energy site stratification.

Plant energy map Plant energy map

Public electricity grid 110kV in.
Site transformer T1 40MVA
Site transformer T2 25MVA
10kV bus MV-01 / MV-02
Process critical load Pressure / Welding / Machine Processing
Energy Storage Systems PCS 1.5MW
Measurement and boundary PCC / Submeasure
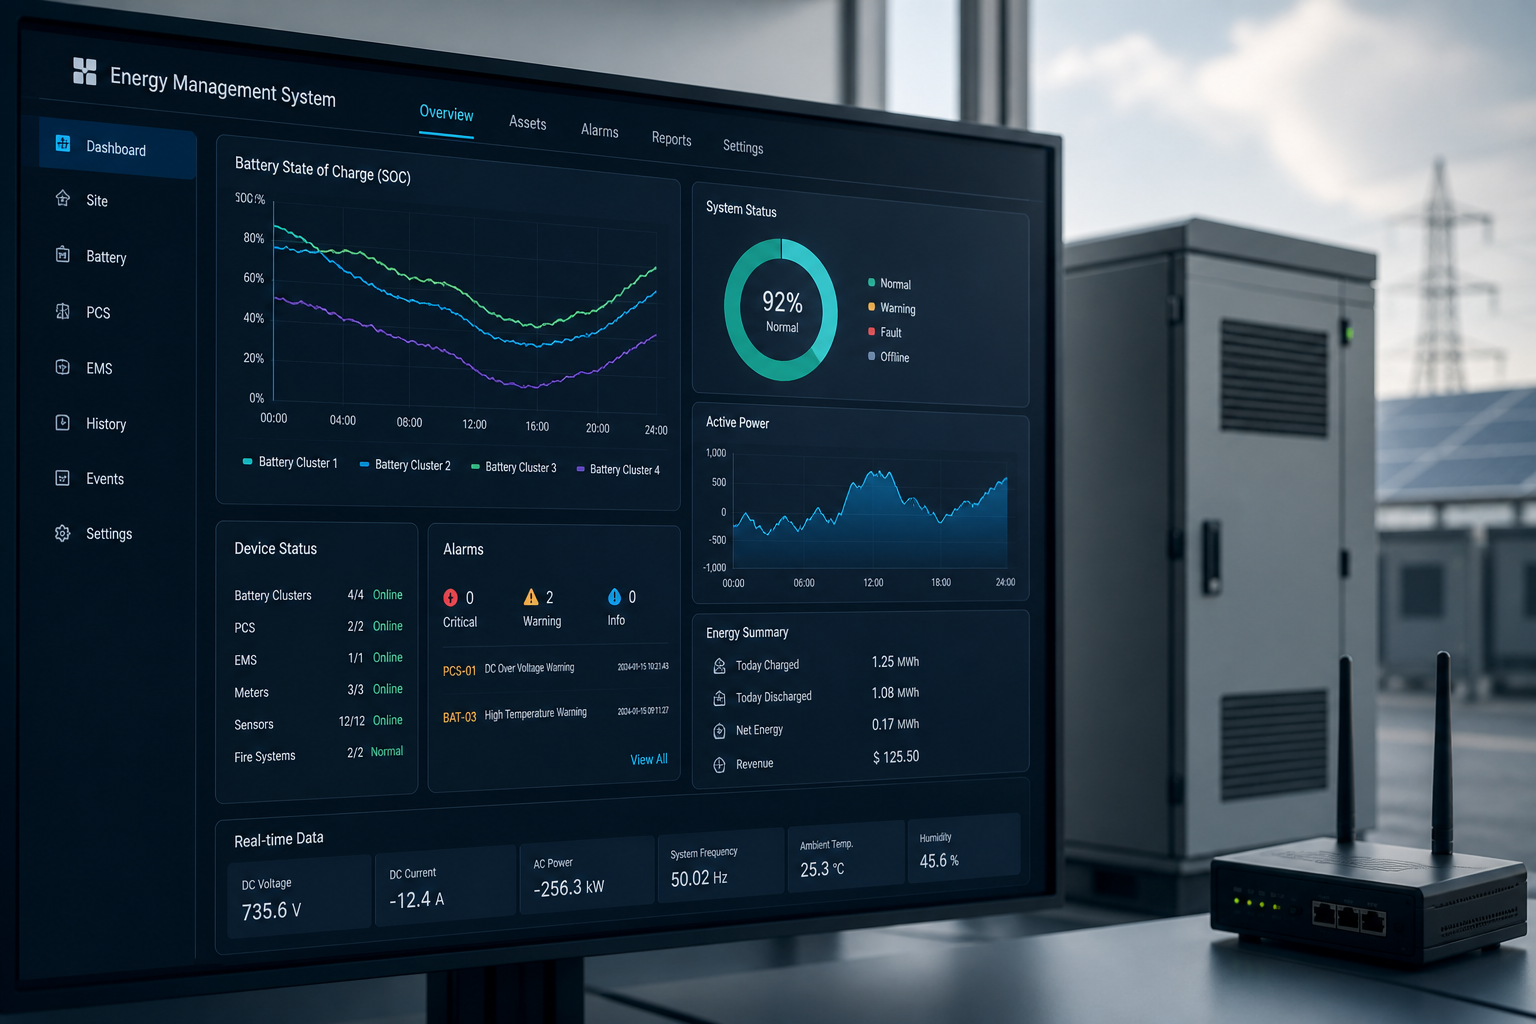
EMS Central Energy Management System

24 hour production synergy Production plan, load forecasting, storage and power transfer

Order A
Order B
Order C
Pump
Welding
Machine processing
Combination
Packaging / Out

The energy strategy must be subject to production constraints and electrical boundaries.

Interrupable / adjustable load Air presses, cold stations, support systems
Process continuous load Pressure, welding, machine beds and continuous production lines
Safety boundaries Fire, PLC, Key Control Systems
Maintain / Fix Window Energy movement in connection with production plans
assembly process
Peak load
Welding
Continuous load
Large power equipment
Impact load

Industrial load structure Industrial load autopsy

Typical load composition

Pressure / Form 28% Welding 22% HVAC 16% Machine processing 12% IT / Automation 12% Other 10%
Load Type Typical features Response Time Risk conditions Schedule level
Pumping Area Periodic shocks 3–8s Power drop. Level A
Welded wires Medium fluctuations 0.5–2s Harmonisation / Volatility Level A
Continuous production line Stable high load. min High-risk shutdown Level A
Machine-processing equipment Medium fluctuations 1–5min Production rhythm effects Level B
HVAC / Cold Station Delayable adjustment 10–60s Comfort / Process Temperance Level B
Cut
Peaking Strategy On demand and transformer load
Move
Production peaks Combining shifts and order adjustments
Ping
Impact Smooth Reserves can compensate for second-degree power fluctuations.
Paul.
Critical security Ensuring continuity of core production loads
Ready
Standby capacity Maintenance of emergency power and SOC security line

Integration architecture EMS-MS-SCADA Integrated Structure

Enterprise application level
Order / Schedule MES Energy costs KPI Business statement
EMS Energy Management
Load forecast Portable capacity assessment ESS dispatch Optimizing controls Policy down.
SCADA Control Layer
Status monitoring Protect / Chain Remote Electrical Quality Event Record
Device Layer
PLC / RTU Relay Protection meter / electrical mass Frequency Variable / VFD PCS / BMS

From the plant target to the multi-chamber distribution. From the plant level target to multi-chamber power distribution

Total power target 0.58 MW
Storage capacity 6.0 MWh
Average SOC 61%
Number of cabinets available 4 / 5
Counter #1 SOC 62% 0.14 MW Available
Counter #2 SOC 60% 0.12 MW Available
Counter #3 SOC 58% Fault Not Available
Counter #4 SOC 63% 0.16 MW Available
Counter #5 SOC 61% 0.16 MW Available

Continuous versus intermittent processes Continuous / intermittent process comparison

Process type Typical features Energy dispatch
Continuous processes Continuous production / Not interrupted Stable supply + reserved capacity
Interrupt Process Run / Switchable beats Move Peak Schedule + Flex Power

Key feeds and quick recovery Key feeds and quick recovery

Inspection Fault detection Protect Action Recognition
Interval Load isolation Broken area.
Storage The reserve can take over. Critical load support
and Re-engineering Backup feeder input
Heave! Restoring production Gradual recovery of load

Electricity quality and protection Electrical Quality and Conservation Matrix

Monitoring item Indicators Limits Measures
Pressure deviation RMS ±5% No / PCS reconciliation
Frequency Hz ±1.0% Rapid Power Response
Harbo. THDi <6% Filter and Optimizing Control
Power factor PF ≥0.95 No compensation for merit

Protection Coordination The point of protection.

Set Design set value Feed / Transformer / Master
Match Configuration Connection Device Communication / BOM
Simulate Multiple scene simulations Short-circuit and islanding boundaries
Loop Run closed loops Event / failure / validation

Phased retrofitting, non-stop production. Phased retrofitting, non-stop production.

1 Programme design and simulation Energy model / electrical boundary / program validation
• Prefabricated and FAT equipment Prefabricated energy, cabinets and communications
3. Divisional access Sector-by-sector transition using a shut-down window
4. Joint verification Run curves, protection and control authentication
5 Strategy and optimization Production rhythm and energy strategy continuously optimized

Digital Twins and Events Replay Digital Twins and Events Replay

Digital twin models

HIL / Simulation Environment

Historical event playback

Operate Board and KPI Watchboard and operational evidence.

Maximum load 7.42 MW
Energy consumption per unit 2.18 kWh/u
System availability 99.2%
Peak Reduction 0.18 MW
Multi-dimensional analysis: decomposition of energy consumption by workshop/ shift/ order/ device.
Operational evidence: Peak reduction, SOC, load, unified event mark.

Project life cycle Project life cycle

research Needs research Process / Energy
Set Solution design Simulation / Optimization
Pick Project implementation Device / Integration
Transfer Joint inspection and inspection FAT / SAT
Transport Operational monitoring KPI/ Event
Yu Continuous optimization Policy / Parameters

Delivery results Delivery results

Figure Design File Electrical / Control / System Structure
Report Technical report Simulation / Calculating / Policy Statement
Measure Test report FAT / SAT / Receiving and Inspection Data
Transport Operational Manual Operation / failure / maintenance process
Number Data assets Event / KPI / Baseline data

NEXT STEP

Combine the boundary and delivery path around the Industrial Energy Management

Programme configuration and implementation tempo can be further confirmed on the basis of on-site loads, netting conditions, installed space and transportation requirements.