


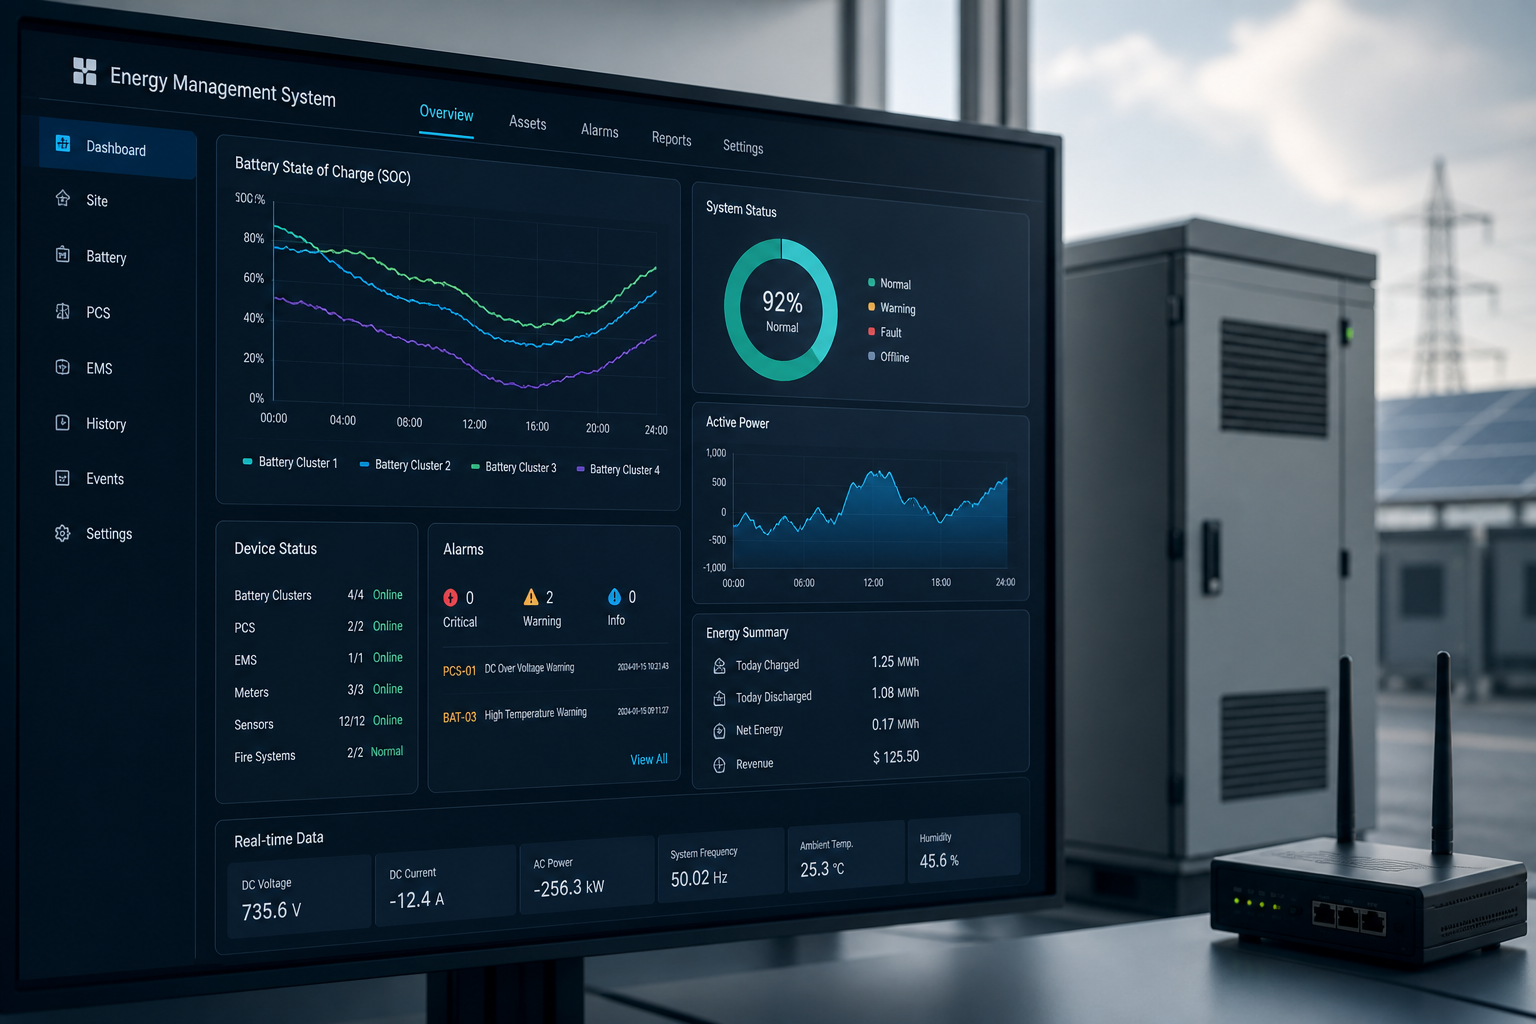

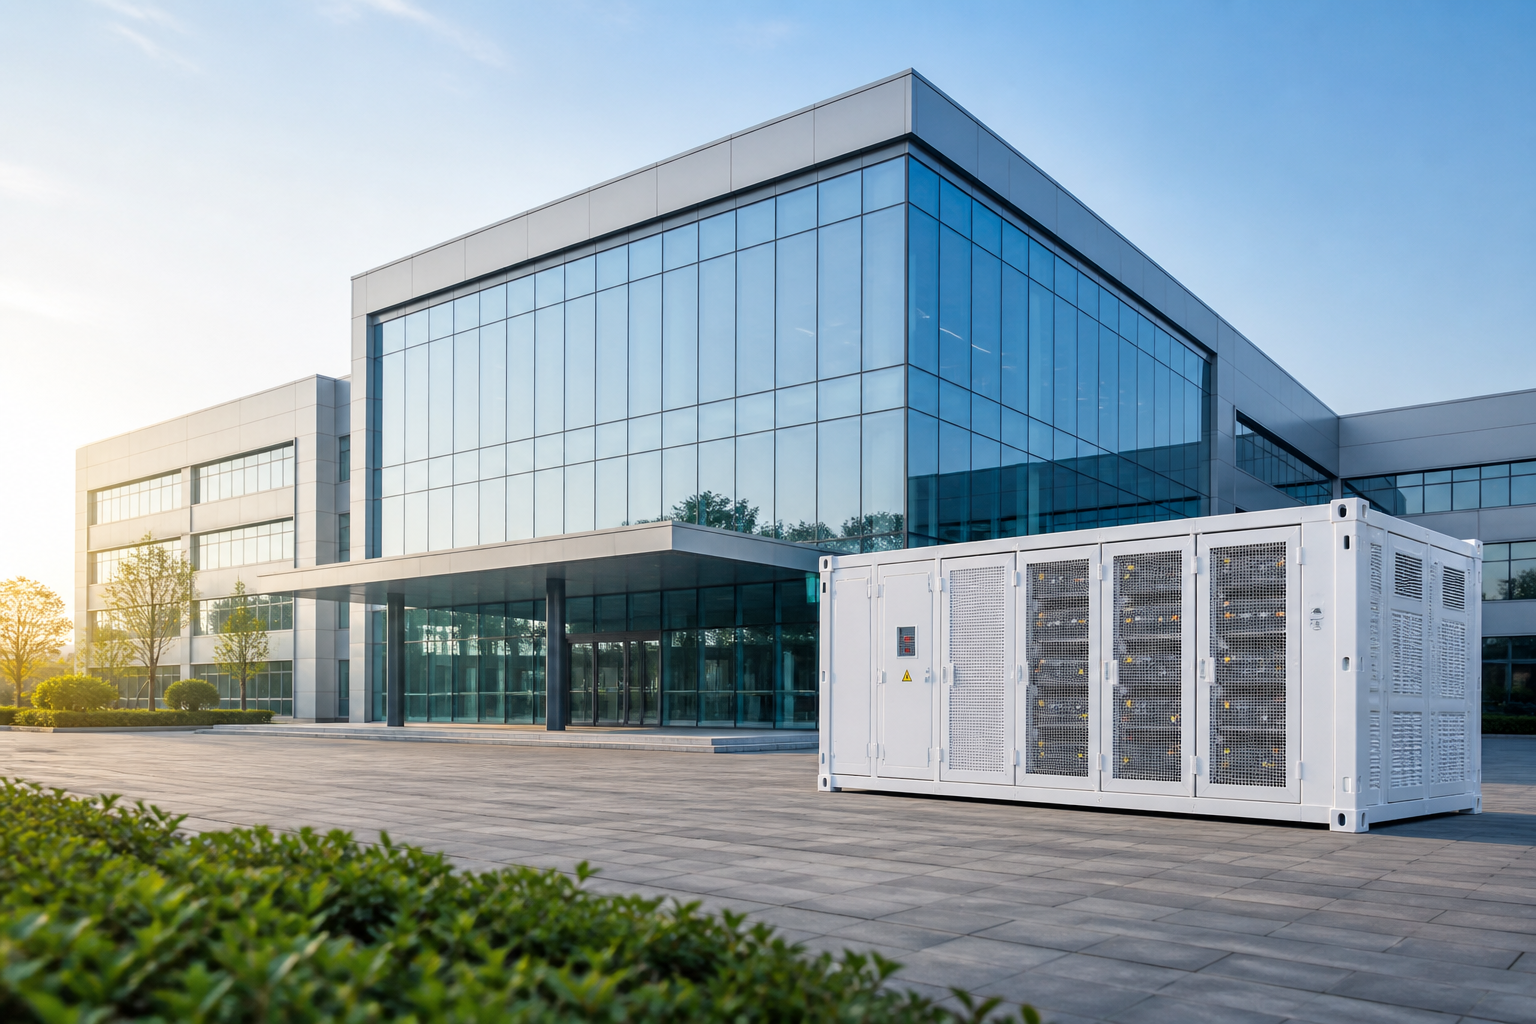
Project Configuration
1P15S
15 Pack / 356kWh
DEMO PROJECT
With 5.064 MWhEngy Storage Systems,
With 5.064 MWhEngy Storage Systems,
Get the PV station output into the programmable boundary.
Item number
TC-DEMO-PROJ-PV-5064
System Capacity
5.064MWh / 1.25MW
Status
COMMISSIONED
Storage capacity
5.064MWh
DC
PCS rated power
1.25MW
±0.625Mvar
Grid voltage Level
35kV
Up and back.
Time of shipment
2024 Q2
Shipped
01 Project profile and border conditions
Project objectives
- PV generation is planned to be enhanced and output fluctuations reduced.
- To meet the power smoothing requirements for grid movement commands.
- Optimizing light-voltage and reducing discarding.
Application Scenarios
- Accompanying large-scale centralized photovoltaic power stations.
- The storage side is responsible for programme tracking, peaking and power reconciliation.
Networking and scheduling
- 35kV-lift pressure and dock 35kV bus.
- Support for AGC / AVC and grid power control.
Border conditions
- Ambient temperature: 20 ~ 50 °C
- Altitude: 1,500 m
- Protection level: IP54 outdoor type
Weather and radiation (typical days)
Peak radiation
1,020 W/m²
Total horizontal exposure
5.32 kWh/m²·d
Ambient temperature
15–32 °C
Wind speed
18 m/s
Photovoltaic power projection (D-1)
Photovoltage scale
3.75 MWp
Projected daily power generation
18.6 MWh
Projection MAPE
6.3%
Power grid plans and constraints
Planned online curve
Smooth Output
Maximum grid power
1.25 MW
The climb rate is limited.
≤10% Pn / min
02 System scale-up and one-time wiring.
Optical Array (DC)
The trough.
DC CombinerEnergy Storage Systems(BESS DC Block)
PCS
1.25MW±0.625Mvar
step-up transformer
0.69 / 35kV35kV switchboard
Grid Connection Status
35kV
EMS
BMS
PCS controller
meter
Power loop.
Communications circuits
03 Area layout and System Information
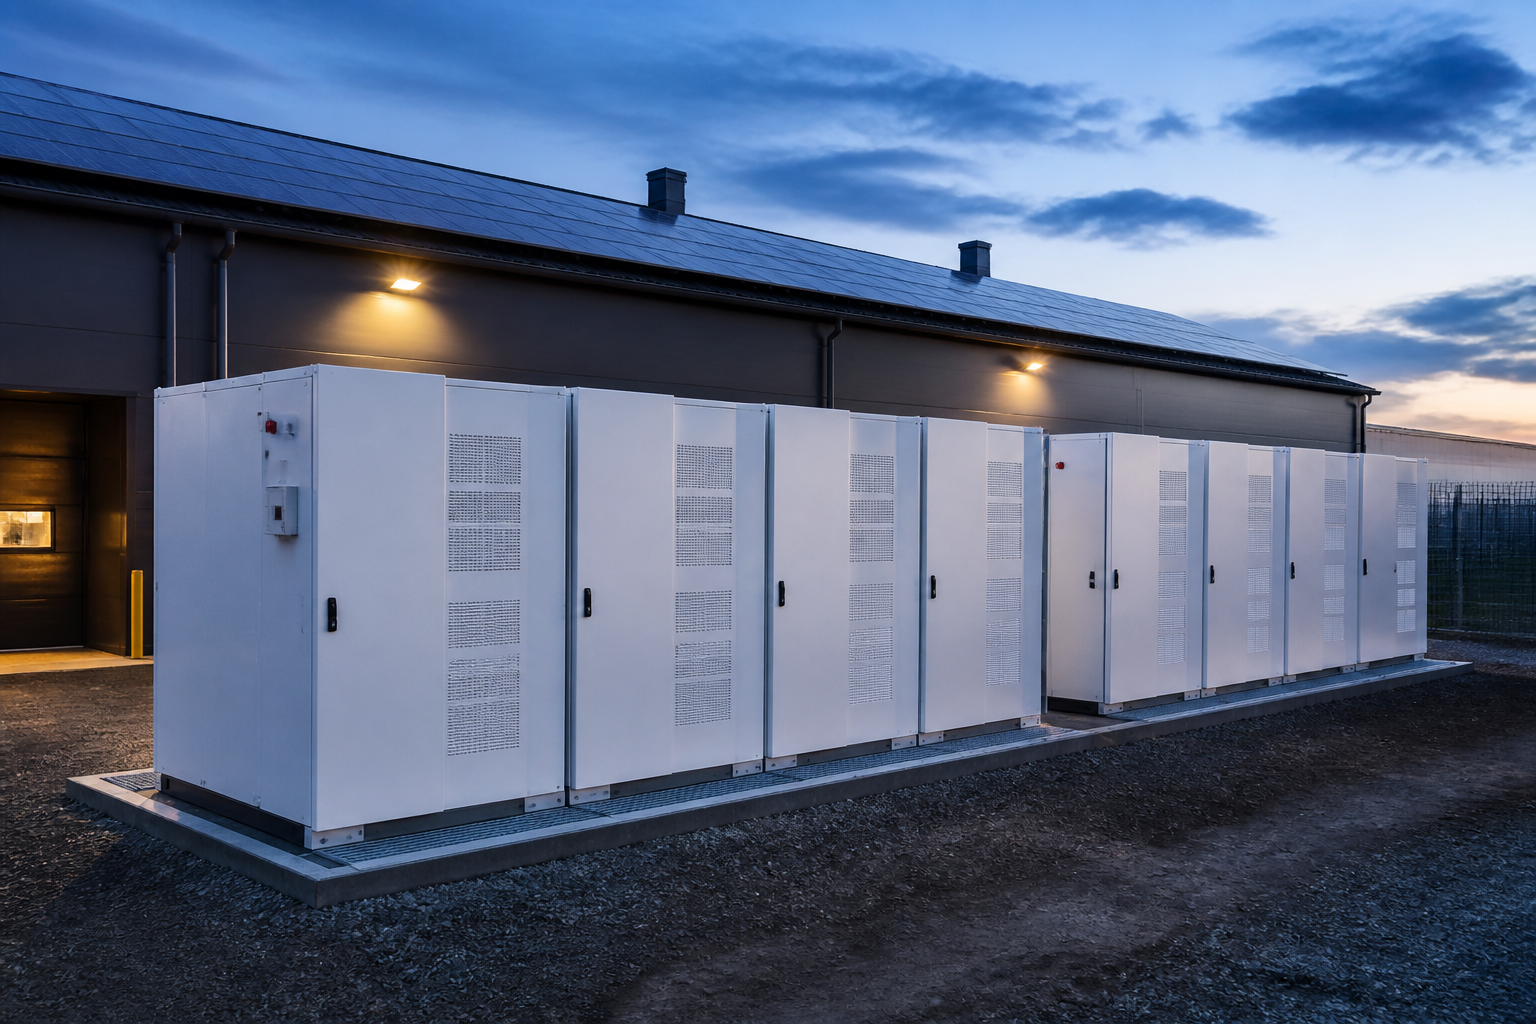
- 15 containers of battery systems: Centralized deployment as required by maintenance, fire and transport routes.
- Outdoor installation: Meet IP54, dust, rain and heat-dispersion requirements.
- PCS sector: Close to the currents and pressure transformers to reduce communication losses.
- Pressure station: Access site 35kV public carrier.
- Cable path: Direct flow, communication and communication layers.
- Fire system: Battery area separate partition and access station fire.
04 Dispatch closed loop: forecast — optimize — execute — feedback
Planned vs actual (net power)
Power deviation
MAPE(days): 4.8% & nbsp; & nbsp; Max Offset: 0.18 MW
05 Delivery and field integration
1. Receiving and Inspection (FAT)
- Black-Box Testing
- Charge/Discharge Testing
- Protect & Lock Test
- FAT records archive
2. Transport and arrival
- Specialized transport programme
- Full container equipment transport
- Date of arrival and receipt
3. Hanging in place
- 80t car hanging
- Positioning review
- Basic installation
4. On-site connection
- DC cable connection
- AC busbar connection
- Communications and fibre-optic access
5. System connectivity
- Single debug
- System connectivity
- Protect Logical Validation
06 Organisation Typical test results
Power Tracking
Set: 10% Pn/min
Maximum measured rate of change:
8.6%Pn/min
Photovoltaic capacity
BESS absorption change during high-irradiance periods
Absorption of energy:
1.32MWh
SOC Run Window
Set: 20% - 90%
Range:
24%–88%
Battery cabinet temperature distribution
Maximum temperature difference
Temperature difference:
6.3°C
System efficiency (direct flow)
Charge Energy Ratio
Return efficiency:
93.8%
07 Performance check and error loop
| Item | Acceptance and inspection indicators | Measured outcome | Decision | Remarks |
|---|---|---|---|---|
| Maximum grid power | ≤1.25MW | 1.21MW | PASS | — |
| Discount / Absorption Power | ≤0.625MW | 0.625MW | PASS | — |
| Rate of climb | ≤10%Pn/min | 8.6%Pn/min | PASS | — |
| Power tracking deviation | ≤2.0% | 1.32% | PASS | — |
| SOC Run Window | 20%–90% | 24%–88% | PASS | — |
| Available capacity | ≥100% | 6.3°C | PASS | — |
| Communications and protection | No frame thrown / Correct Response | Test passed. | PASS | — |
| Serial number | Problem description | Reason analysis | Measures to address | Status |
|---|---|---|---|---|
| 01 | Early peak can input deviations | Projections of changes in models | Optimizing model parameters | Closed |
| 02 | The individual cabinets are shaking. | Port network delay | Adjust Switch Settings | Closed |
| 03 | SOC lower limit triggered earlier | The plan is conservative. | Adjust SOC Window | Closed |
08 All-day energy running view Typical Day
09 Incident milestones and deliverables
Project milestones
Delivery package (example)
System Design Document (SDS)
BMS/ EMS logs and parameters
Off-site test report (FAT)
Protect fixed values and aggregate information
On-site Receiving and Inspection Report (SAT)
Operations and maintenance manual
Performance report (PAC)
Run a list of events
Cables and wiring
Training Records
Let every light be planned and used.
TIANCHU provides a programmable, verifiable and deliverable energy storage systems for large power stations.