

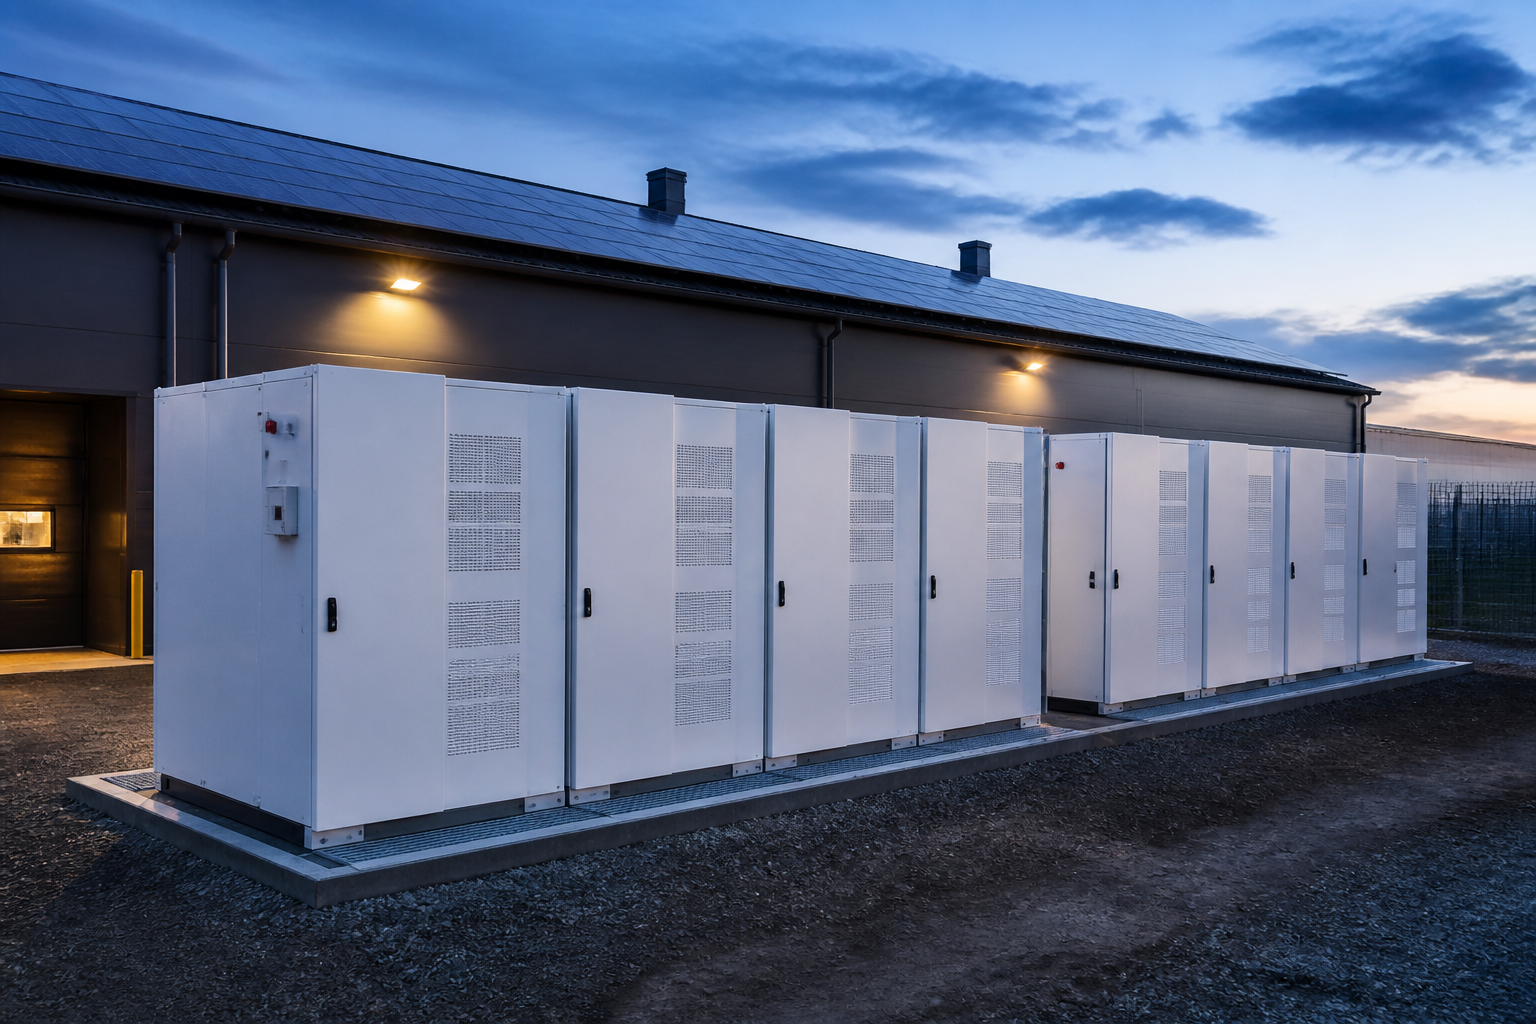
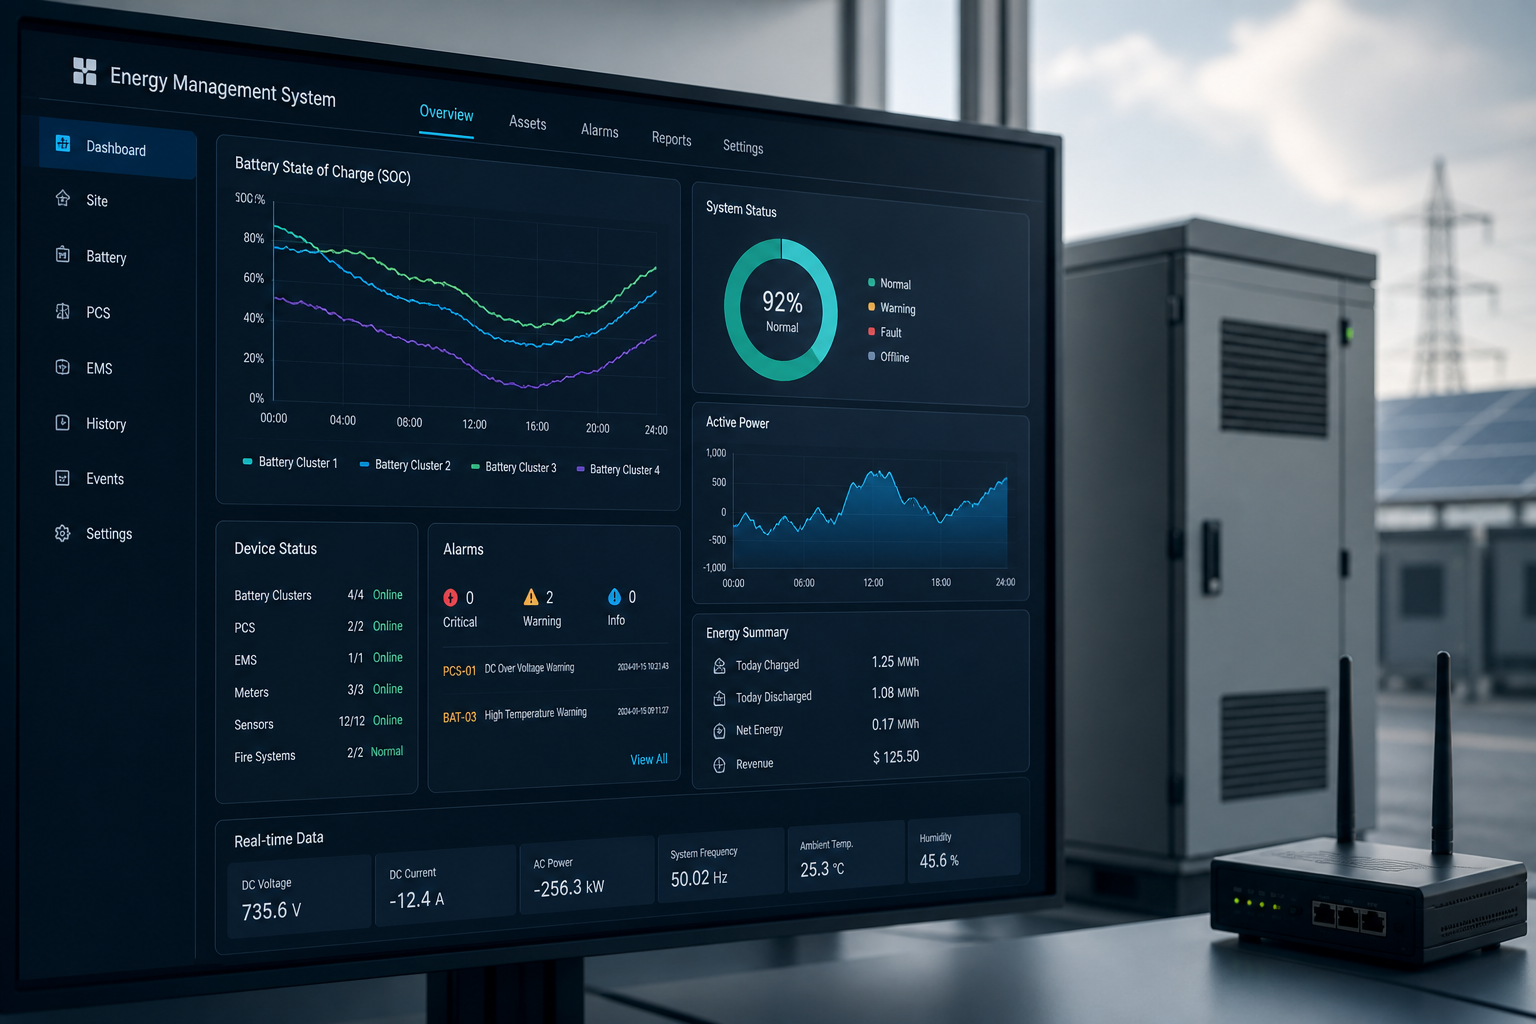

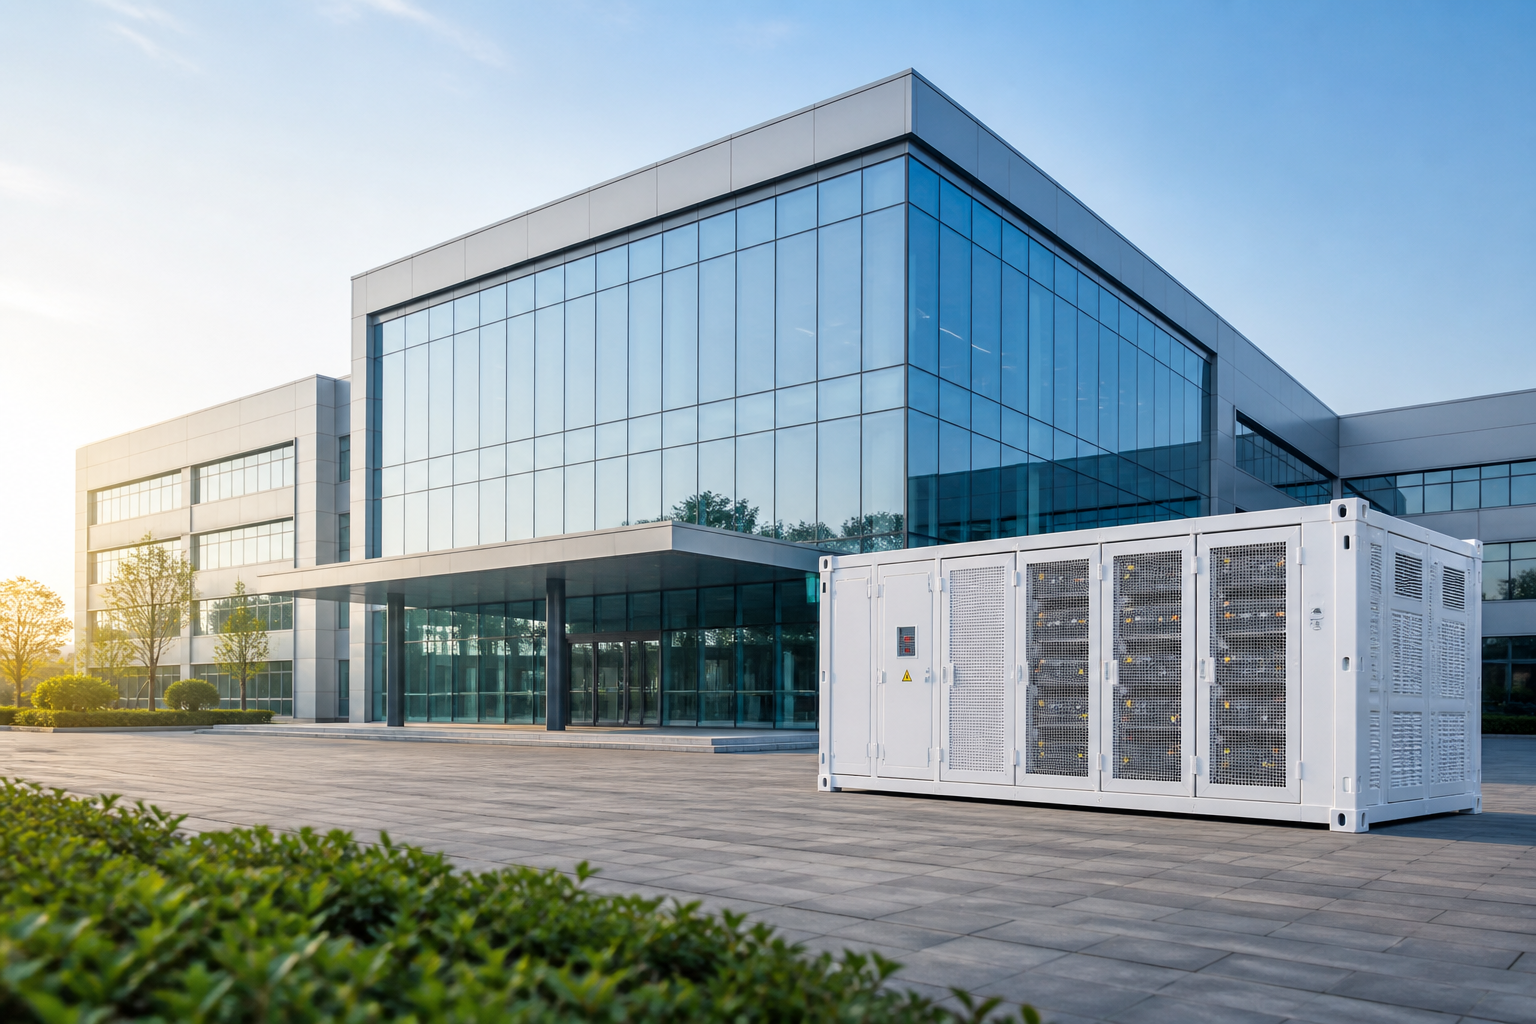
Integrated lithium battery energy storage solutions
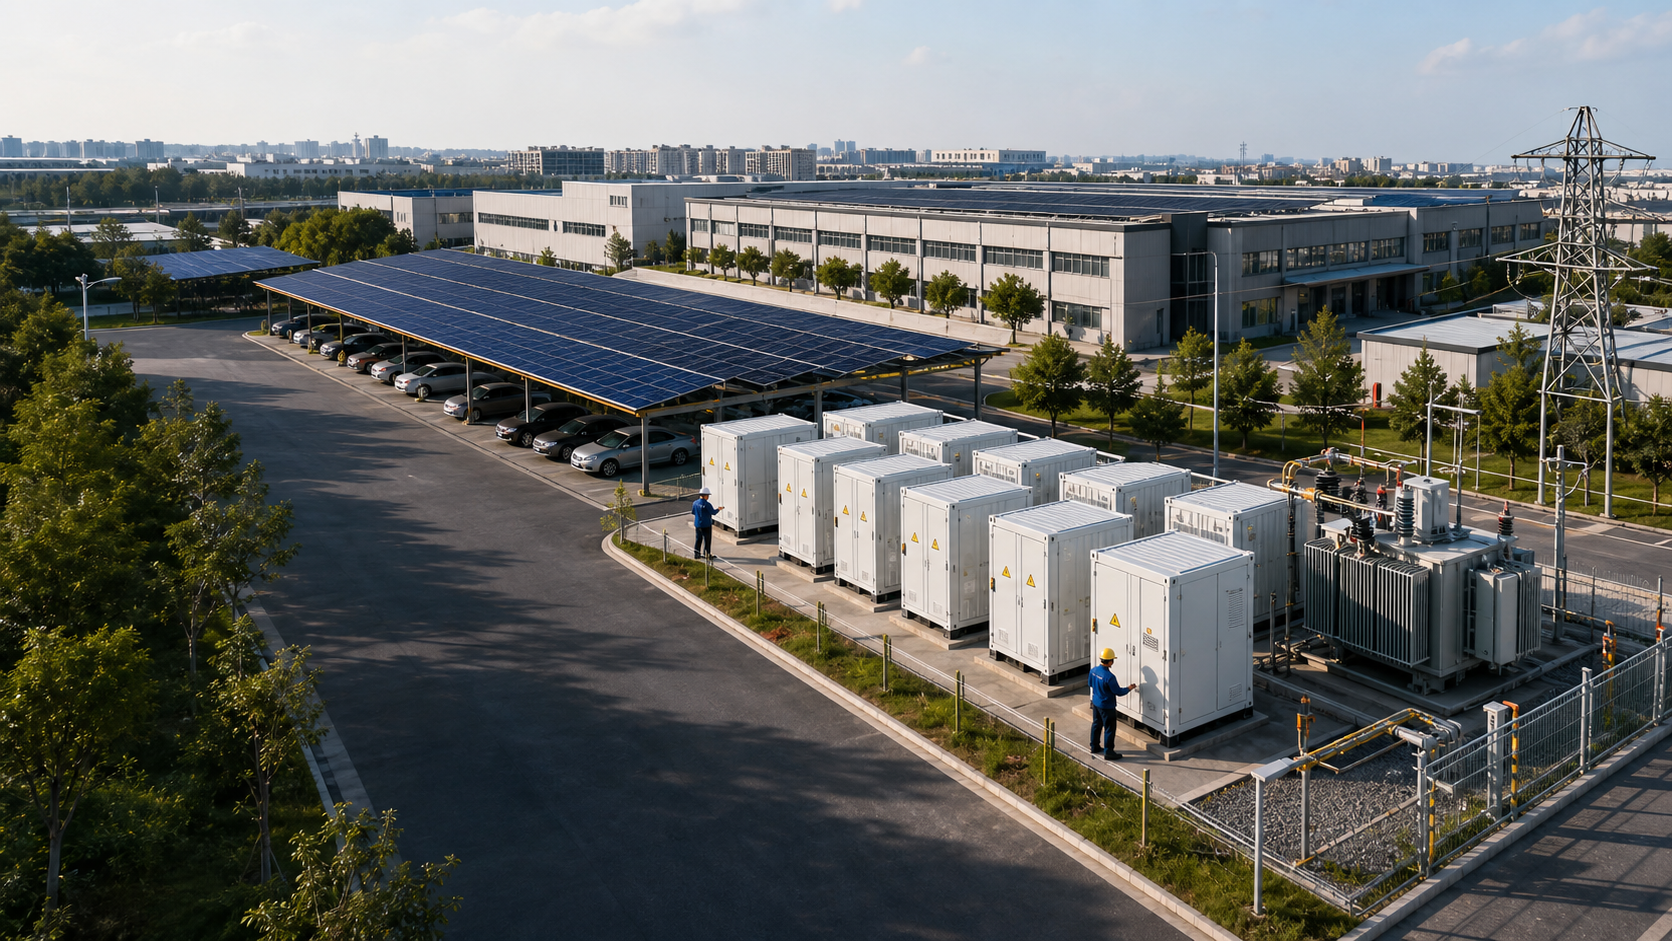
Photovoltage, energy storage and power distribution at business parks

Commercial & Industrial Solar + Storage

Let the light come out, save it, and use it if you need it. Move!

• Plan to implement three tiers of synergy to integrate photovoltaic, storage, park loads and grid-connected points into the movement and to improve the rate of new energy consumption and system economy while meeting the grid-connected power boundary.

Overview of real-time operations EXPORT LIMIT
Photovoltage 2.46 MW
Park load 1.82 MW
Battery charge 0.51 MW
Network power 0.13 MW
Export ceiling 0.15 MW
Battery SOC 58% Real-time status
Light
Solar co-planning Common design of capacity, power and grid-connected boundaries.
Complex
Power tracking smooth Reservoir can quickly compensate for the predictions and real-time deviations.
Afternoon
At noon, it's turning. Increase spontaneous self-use rates and reduce discard light.
Sector
Multi-region coordination Multi-reversible, multiEnnergy Storage Systems Division control.

Source-Stock-Holder Network Structure and Border

AC Conclude

Optical Array
→
Photovoltaic transformer
→
Main distribution cabinet
→
PCS
→
Batteries

DC Convergence / Network Control

Optical Array
→
PCS / DC
→
Measuring meters
→
Public electricity grid
EMS / SCADA / PCS / meter / inverter real-time communication and closed-loop control

Same park, three floors of co-operation: predict, plan, real time.

FORECAST

Forecast layer photovolt, load and weather prediction
DAY-AHEAD PLAN

Plan plan to optimize and save power

REAL-TIME ACTUAL

Real-time layer execution of tracking and deviation correction

SOC Upper 90%
SOC Floor 20%
Storage absorbs → Planned implementation (photo voltage/ Load) → Critical hold, plan resume.

Prognosis of decision plans, real-time control of processing deviations

With a grid site as the boundary, EMS converts weather and load uncertainty into an enforceable charge and power command.

Weather forecast/load forecast

  • Irradiation
  • Cloud cover
  • Temperature / Wind Speed

Optimization and scheduling engine

Day/ Day/ Real Time

Set Command

PV Power Recharge / Network Power

PCS
Battery cupboard
Battery cupboard
Main distribution cabinet

Connect Point Metric (two-way)

Grid Connection Status

Measuring feedback (P / Q / V / I)

Four typical operating scenarios, one single system response

It's clear at noon. PV PV PV PV PV PV PV
PV2.60MW
Load1.45MW
BESS1.00MW
Networking0.15MW
Quick cloud power drops. PV Down, storage quick.
PV1.46MW
Load1.50MW
BESS0.70MW
Networking0.00MW
In the evening, the power peak is released. Storage power to support park load.
PV0.20MW
Load2.20MW
BESS1.00MW
Networking0.85MW
Low-load weekends. Reduction of light voltage and storage capacity to absorb residual power
PV1.30MW
Load0.60MW
BESS0.55MW
Networking0.15MW

Layered binding system

Level of constraint Typical constraints Target Control input Control Output
Prior bound 24–48h Forecast Economic objectives Weather / Electricity / Load Charge plan
Chile 2h scroll Fix prediction error Short-term projections Planned amendments
Real time control 1–5min Track power target. PCC / PV / BESS PCS Command
Network constraints 1–2s Hold on, Export Limited. Real-time measurement Limit / Charge
Programme PV BESS Networking
S11.20.5 / 1.00.72
S21.80.5 / 1.00.95
S32.41.0 / 2.01.35
S42.41.0 / 2.01.40
S53.01.5 / 3.01.65

When the cloud crosses the park, the system must secure the border at the netting point.

The shadows have arrived.

t0–60s

Radiation 85%

PV Fast Fall

60–120s

PV 2.10 → 0.65MW

It's an instant fix.

120–180s

BESS 0.00 → 0.95MW

Connect Point Stabilization

180–240s

PCC ≤0.15MW

SOC Security Check

Ongoing

SOC 62% → 59%

Plan resumed

>240s

Result Stable running

Measurement and protection: integrity of the chain of evidence on the Internet

Table Park meter
→
PV Photovoltaic transformer
→
B Battery flow measurement
→
PCS Resilient transformer
→
PCC Net-point meter

06 / Multi-regional coordinated movement
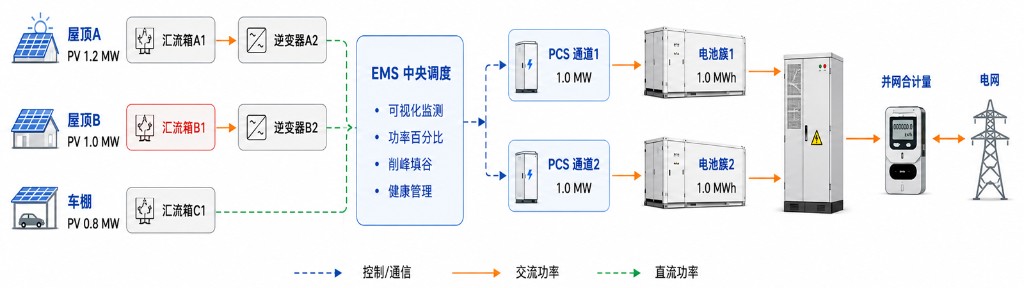
Roof + Shack → EMS Central Schedule → Double PCS Channel

Multi-regional movement: roofs and shed PV EMS central movement, double PCS channel access to battery clusters, grid-connected metrology and grids

07 / Site and delivery

Overall programme and on-site delivery highlights

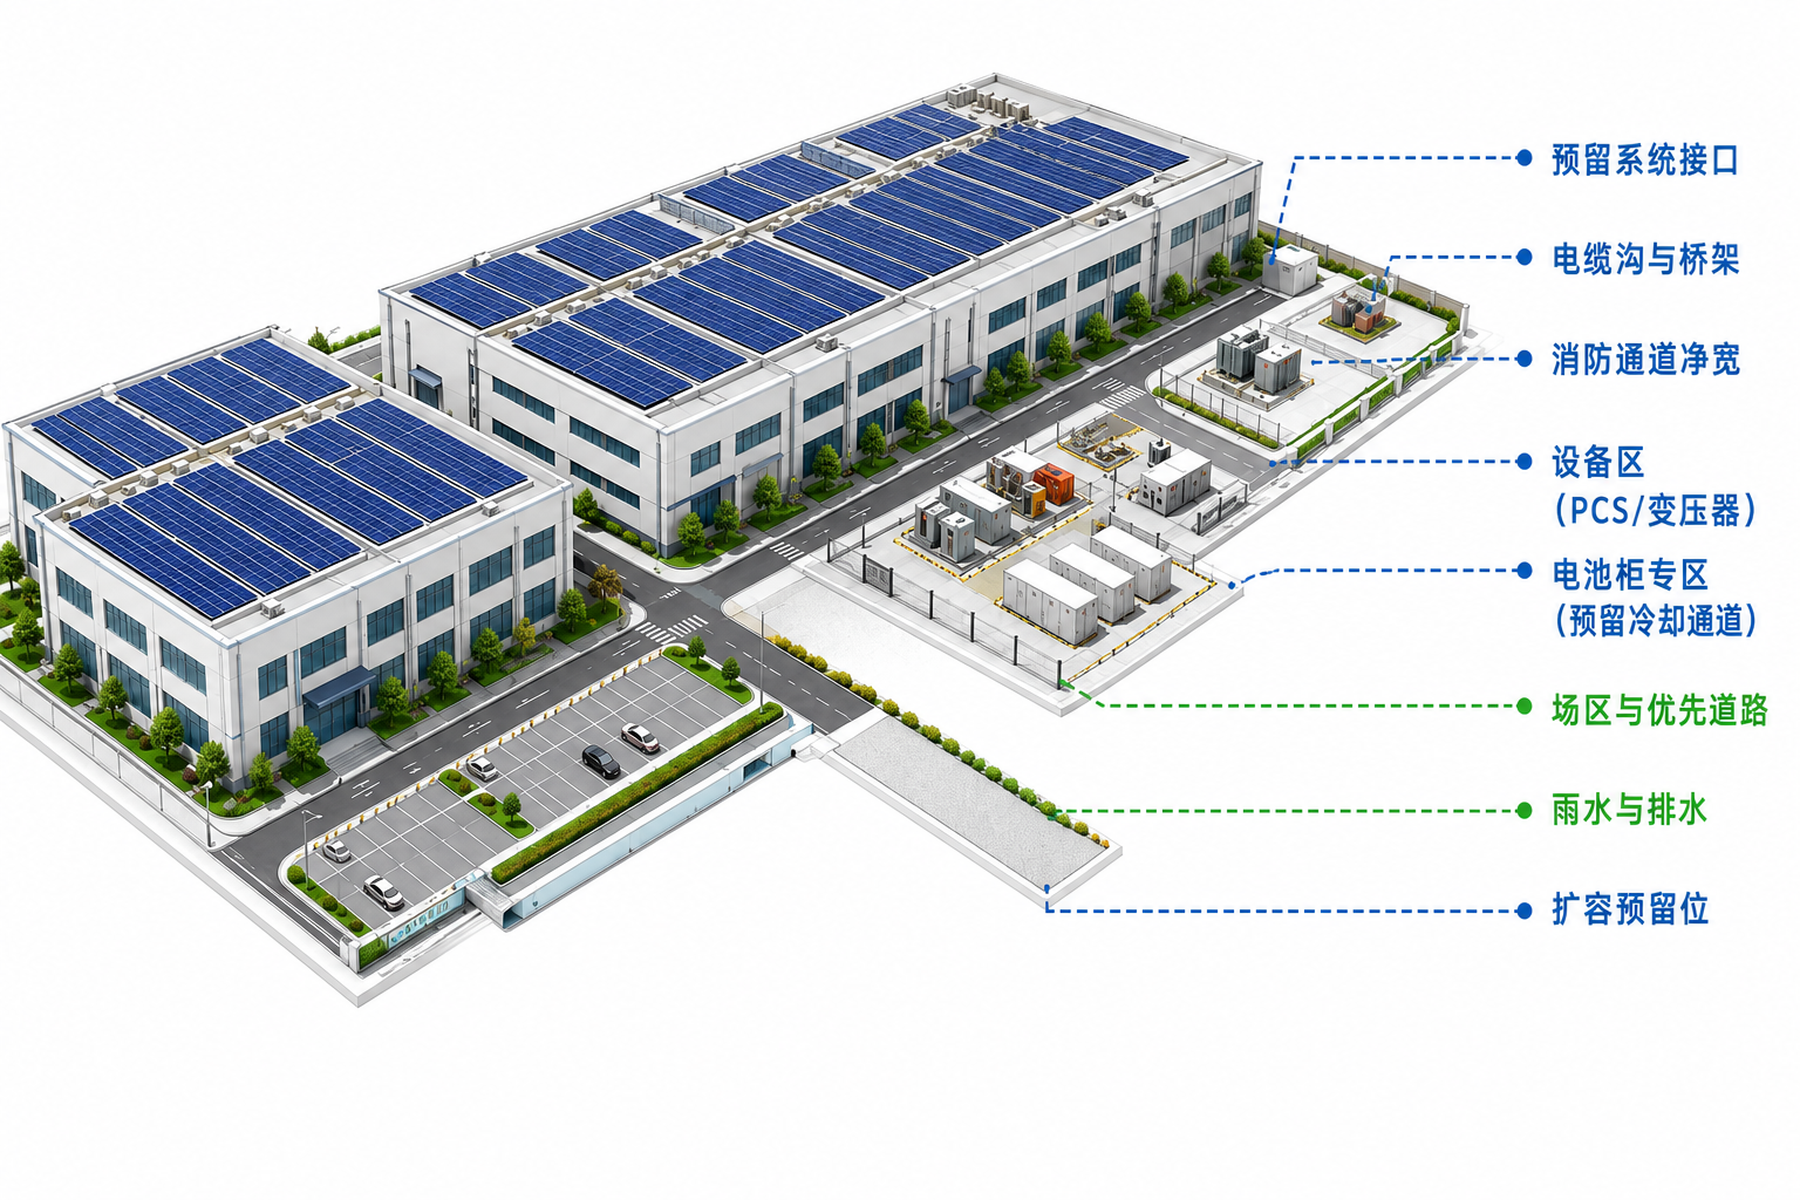
Site set-up: roof PV, storage site station, cable ditch bridge and interface

Device setup

  • Battery cabinet partition, single section 1.0 MWh
  • PCS Approach transformer, shorten cable
  • The transformer capacity is set at 15% or more

Transportability

  • Repair channel ≥1.2 m
  • Hanging and removal routes
  • In-situ fire and emergency lighting

Security design

  • Fire-fighting, smoke / temperature
  • Ventilation and ventilation
  • Local & Remote Connection

Expansion and evolution

  • Preserve battery cabinets and PCS channels
  • Save transformers and lines
  • Retain Communications and I/O

Debugging and acceptance: seven key validations

Authentication items Verify Target Methodology Criteria for determination Status
Network power limit Verify PCC power closed loop Step / MAPE PV MAPE < 9.2% Passing the rims.
Power Tracking They can respond quickly. Power step Response Time & lt; 2s Passing the rims.
Equipment dispatch PCS distribution correct Power Command Test Error 1.5% Passing the rims.
Storage protection SOC / Temperature Limit Boundary Simulation Unlimited Actions Passing the rims.
Communications failure Disconnected security strategy Network Break Test Local autonomy maintained Passing the rims.
Metric core Data chain alignment It's a match. Error 0.2% Passing the rims.
Failure recovery. System Autorecover Device failure simulation Recovery Time ≤ 32s Passing the rims.

Monthly running report

Electricity generation 84.6MWh
Self-use rate 78.3%
Discard PV 6.2MWh
Storage cycle 12.5 times

09 / Full life cycle

Full life cycle delivery process and output

  1. 01 Data acquisition and modelling
  2. 02 Projections and self-adaptation
  3. 03 System architecture design
  4. 04 Simulation and Policy Authentication
  5. 05 Detailed design
  6. 06 FAT
  7. 07 On-site acceptance and inspection SAT
  8. 08 Operational optimization and delivery
  • Forecast accuracy report
  • System Line Chart
  • Device Layout
  • Control policy statement
  • Protect Sizing Table
  • FAT/ SAT report
  • Monthly run summary

NEXT STEP

Comercial & Industrial Solar+Storage, combing boundaries and delivery paths

Programme configuration and implementation tempo can be further confirmed on the basis of on-site loads, netting conditions, installed space and transportation requirements.