
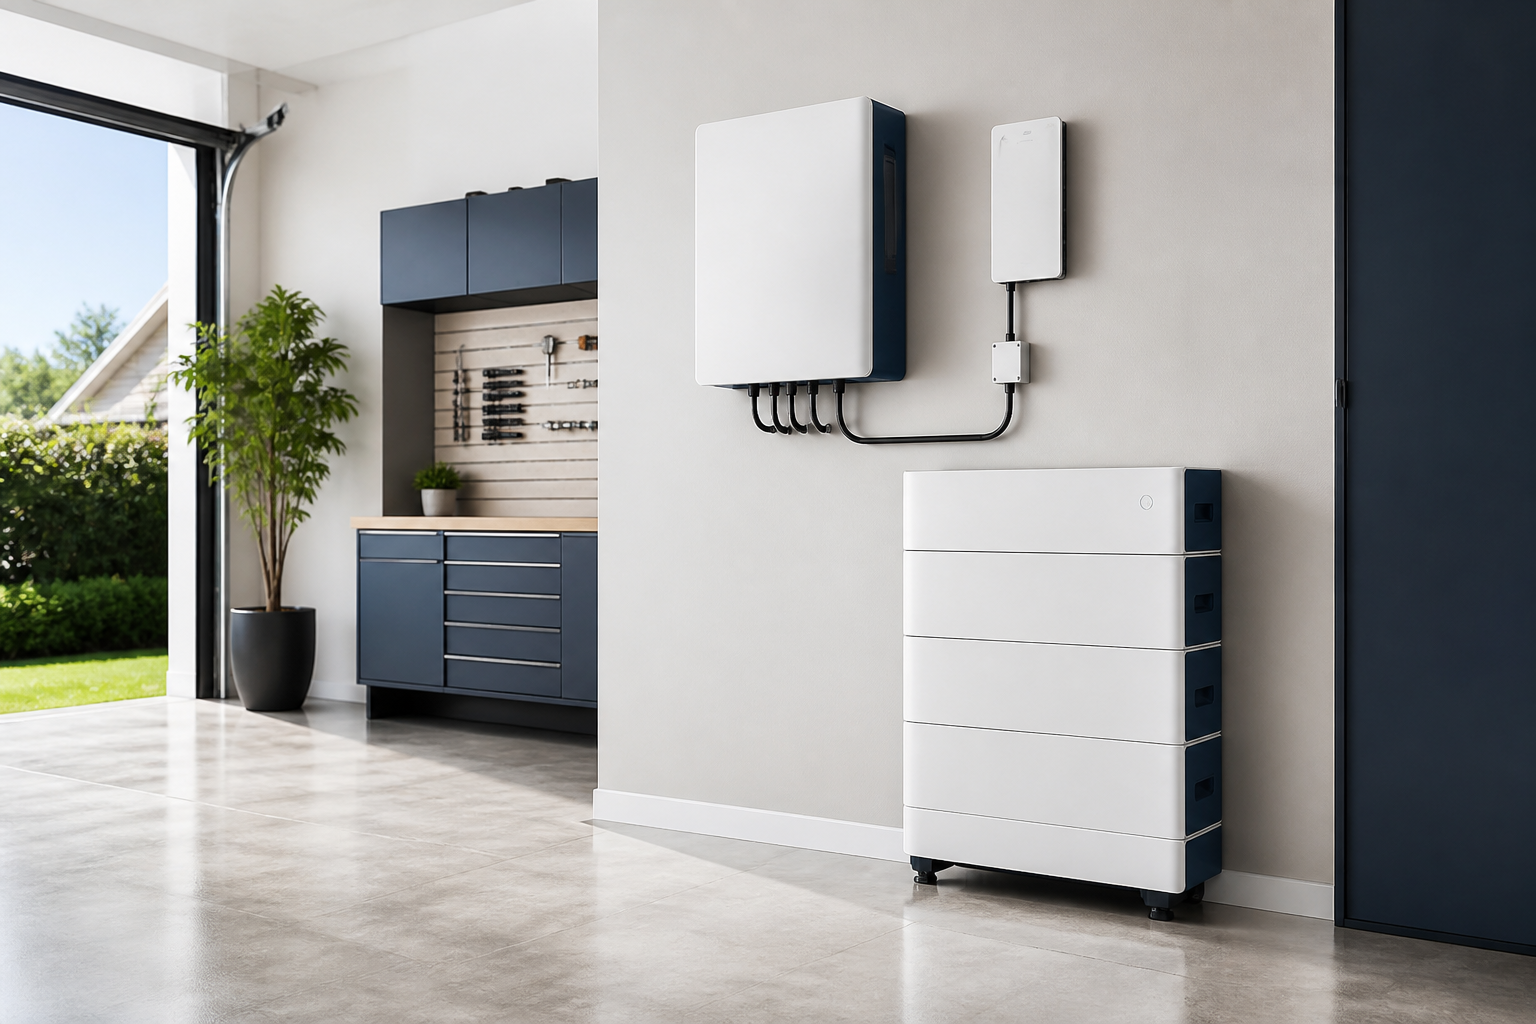

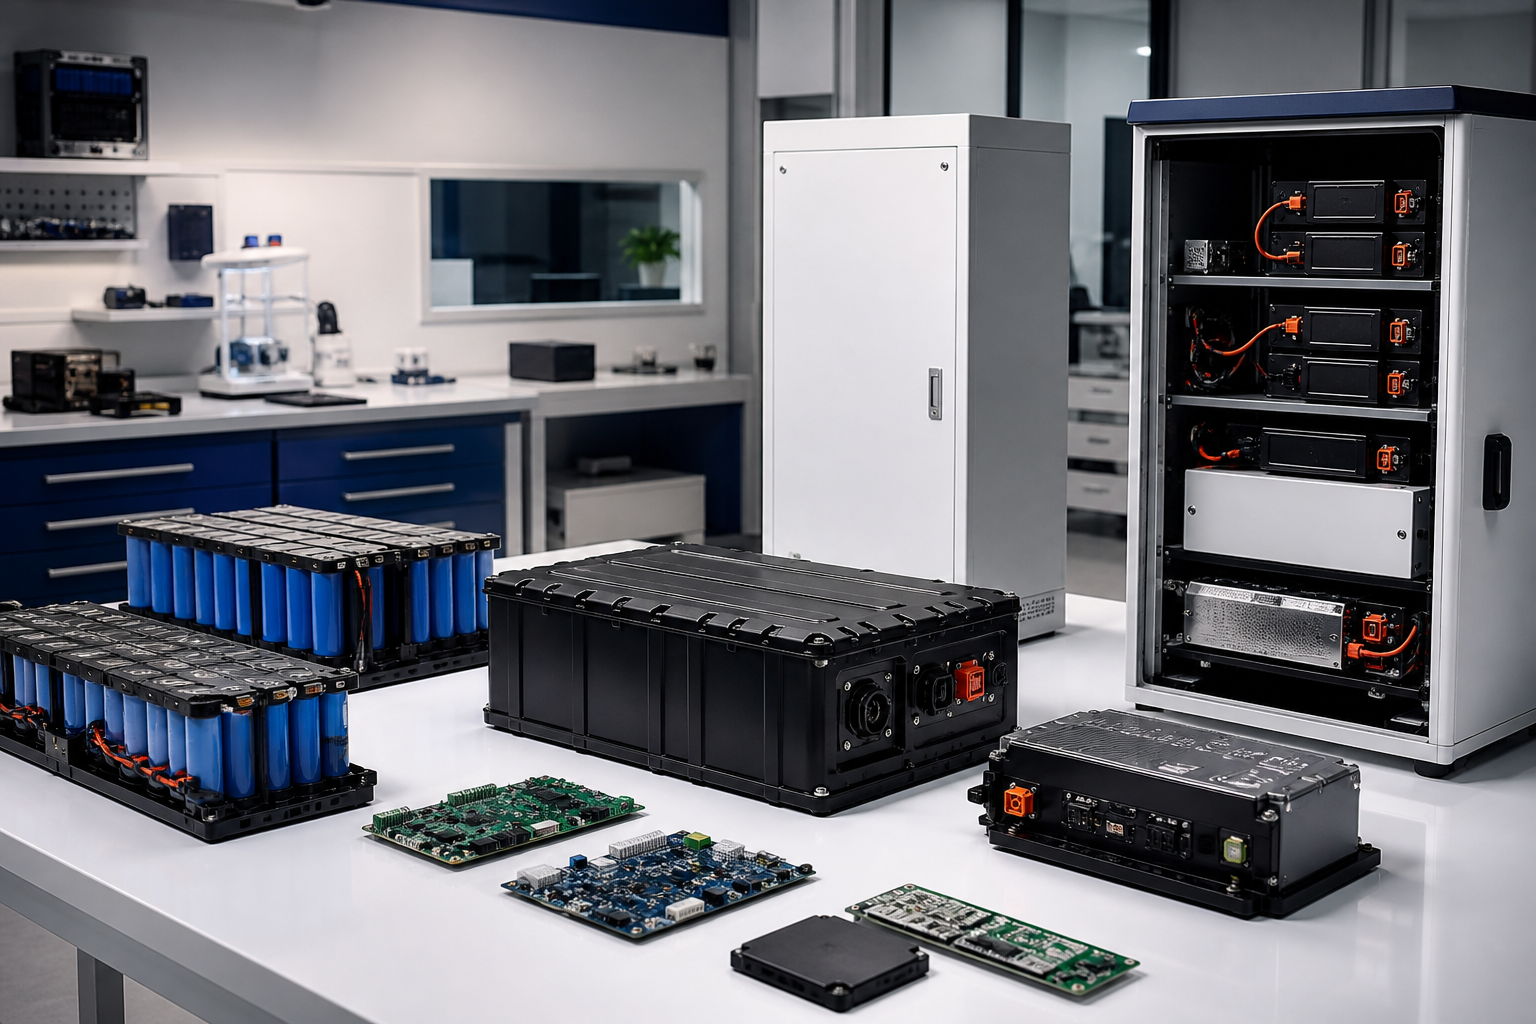

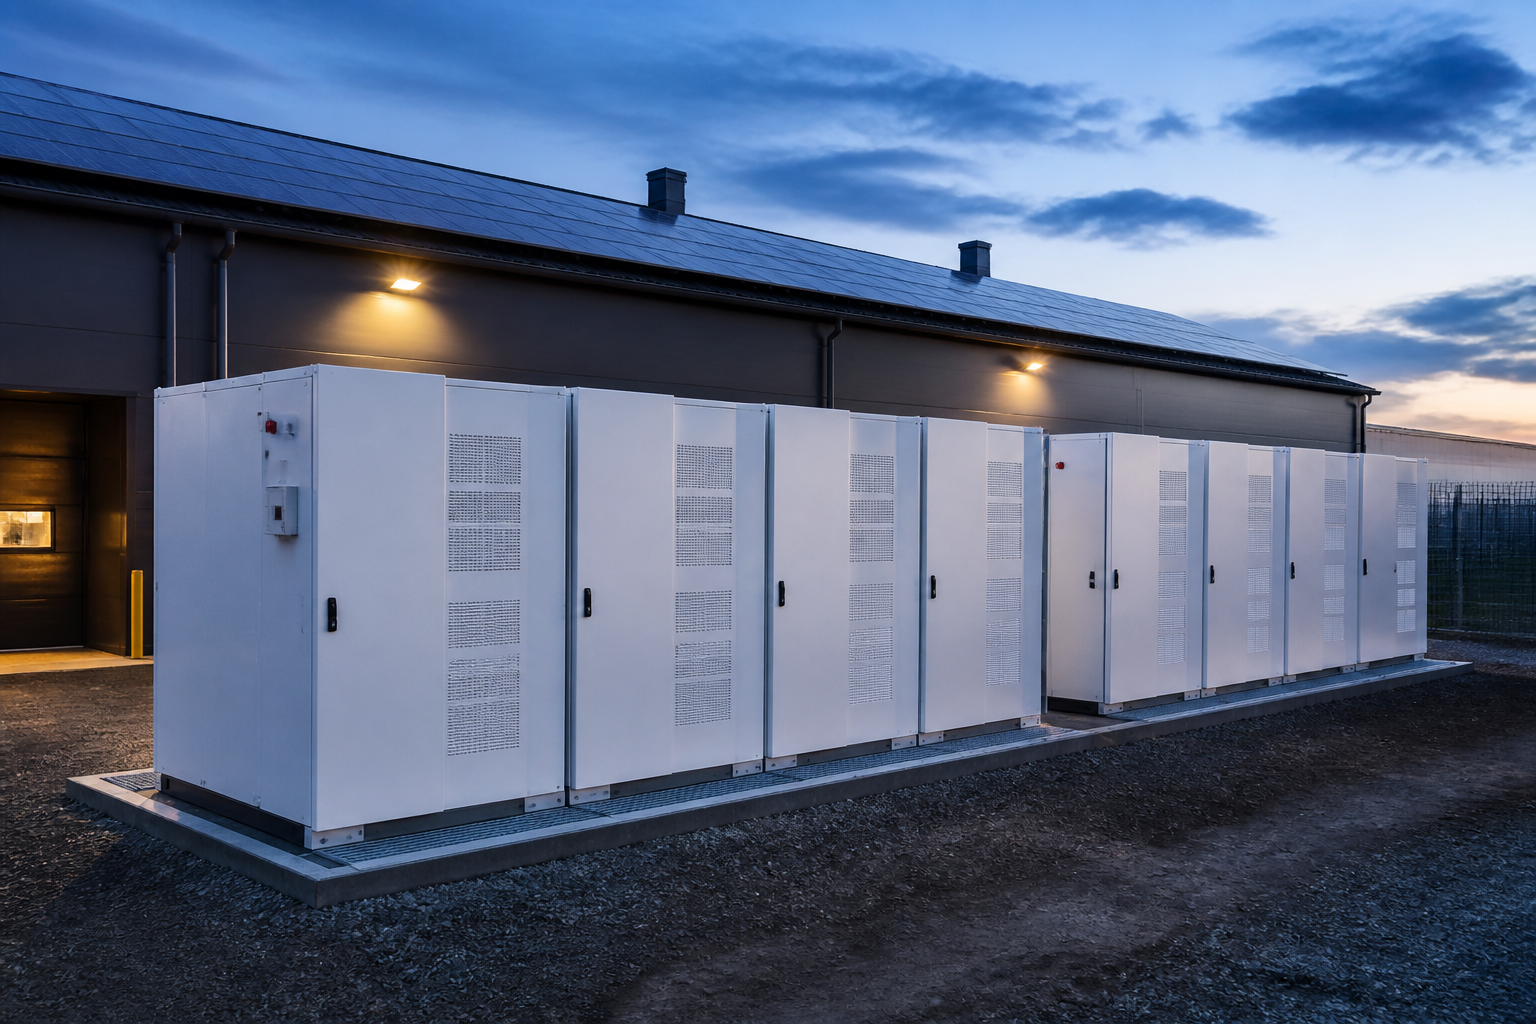

Integrated lithium battery energy storage solutions
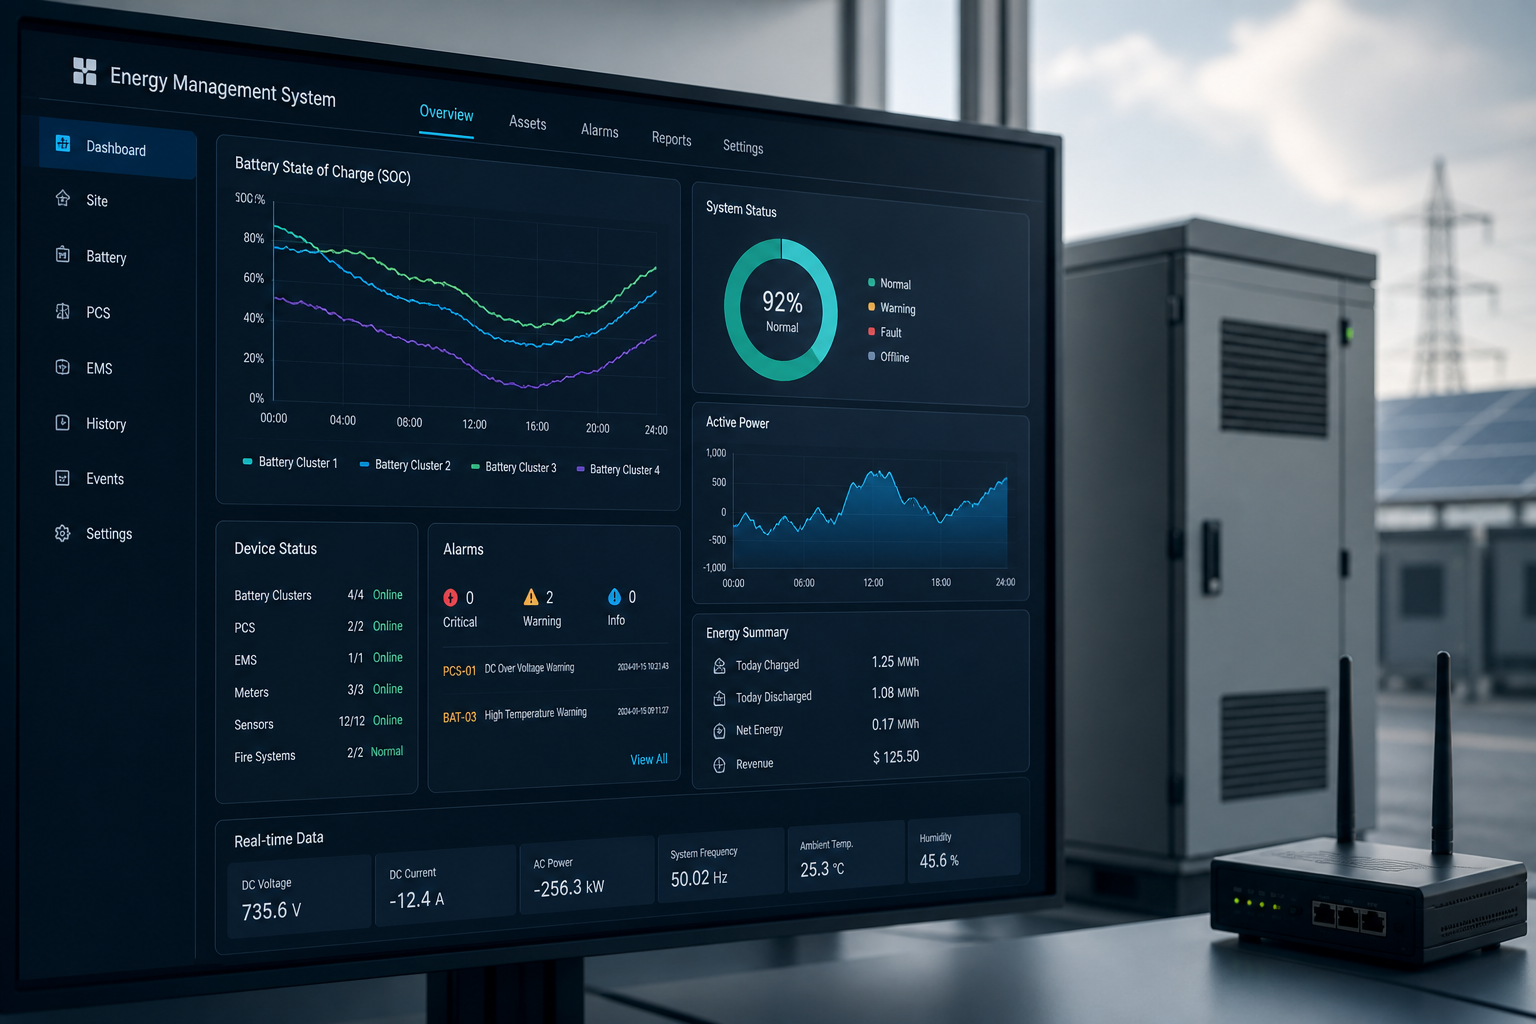
REAL-TIME MONITORING | Real-time running monitoring

Make system operating status visible in real time,
and detect critical changes promptly

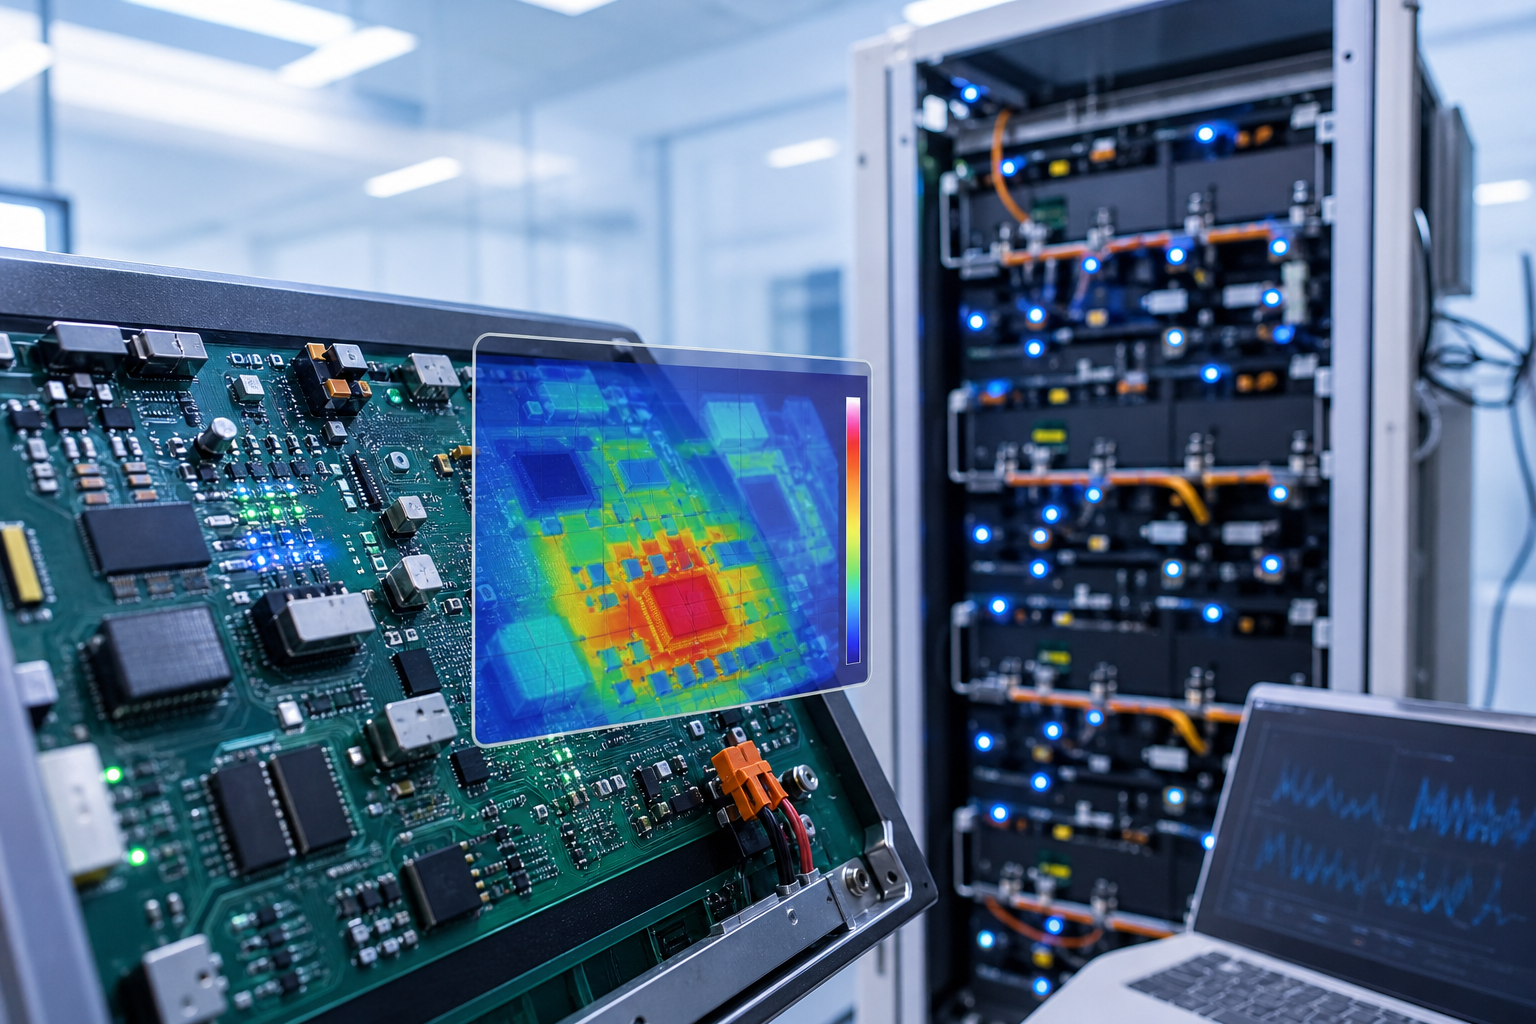
Unify grid, transformer, PCS, DC bus, battery clusters, thermal management, and safety status into one real-time view, and continuously record every second of equipment state, topology, operating change, and critical events on a consistent time base.

Monitoring is more than a single number—it makes object, status, time, change, and evidence visible together.
P Power on the side. +62.35 MW Real value
E Charge today 128.7 MWh Cumulative
SOC System SOC 43.6% Average
ΔT Temperature differential (maximum - lowest) 8.7°C Batteries
HA Availability (equipment) 99.62% Current
RT Monitor delay 287 ms Real-time links

01 System popping and state transmission Position current objects from system to Pack

Electronet / Main Change
PCS
DC Bus
Cabinet / Rack
Pack
Grid Connection Status
35 kV
Main change
230 / 35 kV
PCS-01
PCS-02
PCS-03
PCS-04
PCS-05
PCS-06
PCS-07
PCS-08
PCS-09
PCS-10
CAB-001
CAB-002
CAB-003
…
CAB-199
CAB-200
PACK-001
PACK-016
PACK-032
PACK-064
PACK-113
PACK-128

· A single axis of time that links all operational dimensions

Power, current, voltage, SOC, temperature, cooling, control instructions, safety and event uniform time frames.
Current time: 14:37:42

03 · Trend analysis and event review A change around an operation

Key change point 14:22:15: Compare pre-change, change process and current state.

04 Communication and data credibility Real-time values must also answer "Where, how long, complete"

The chain's expanding.

PCS
Switch A
Switch B
SCADA / EMS
Main link &Normal
Stand by for a link. &Normal

Data link quality

Main link (optic fibre) &Normal
Stand by for a link. &Normal
Drop Rate 0.02%
Average time delay 8 ms

Data update and freshness

Update cycle 1.00 s
Latest data time 14:37:42.287
Monitor delay 287 ms
Clock deviation 3 ms

Data sources and traceability

Data Sources TCG-1000-01
Agreements IEC 61850 / MQTT
Source Path PCS-03 → CAB-001 → RACK-03 → PACK-017
Quality GOOD
Data Signature &Normal
Time rule: (b) Delay values and clock deviations cannot be considered the same indicator.

05 Relay and Play Thirty minutes.

Replay the topology, measurements, thermal state, and events of that moment—do not recalculate history with today’s configuration.
14:12:42 Thirty minutes ago.
Power -18.6 MW
SOC 32.1%
Tmax 31.0°C
ΔT 5.2°C
14:22:15 Incident
Power +21.1 MW
SOC 33.0%
Tmax 31.6°C
ΔT 6.1°C
14:32:42 Ten minutes.
Power +58.2 MW
SOC 42.3%
Tmax 36.4°C
ΔT 8.1°C

06 Duty and Role Desks Same real-time data. Different players see different tasks up and down. Man

Duty calls.

Duty: 06:00–16:00

Holder: Zhang
Legacy issues: 3 items
Attention equipment: PCS-07 / CAB-001
Today's charge: 128.7 MWh

Dispatchers

Operation and dispatch

Current mode: Charge
Network power: +62.35 MW
Command status: Completed
Standby capacity: 8.6 MW

Equipment Engineer

Equipment health and diagnosis

Current object: CAB-001
Tmax: 37.2°C
ΔT: 8.7°C
Communications: &Normal

Security officer

Safety boundaries

Fire system: &Normal
Closed system: &Normal
Insulation system: &Normal
Current risk: Low
Duty transfer: Focus on the legacy of the last shift, the focus of the shift, the activity alert and the current energy status, and create a signed handover record.

07 Evidence Export and Archive

LIVE Real time snapshot Current scale, status, spot and time
EVT Event Package Pre- and post-incident trends and key points
TOPO Topup Status Object relationship and device online status
DATA Data quality records Delays, discards, clocks and sources
PDF Replay Current Page Printing and Archive

08 Boundaries and responsibilities

LIVE

Real-time Monitoring This Page

Answer: what is the system state now, what just changed, and is the data trustworthy?

  • Real time.
  • Real time point
  • Trends and time axes
  • Playback and Snapshot
ALM

Reports and incidents

Event correlation, severity judgement, allocation of responsibilities and disposal of real-time changes are closed.

  • Unusually Associated
  • Event life cycle
  • SLA and disposal
  • closure criteria
ANA

Analysis and reporting

Statistical analysis of performance, efficiency, degradation, trends and asset mix over time.

  • KPI Analysis
  • Trends modelling
  • Long-term reports
  • Prediction and Insight
Ultimate Principle: Real-time Monitoring Object → State → Timestamp → Change → Evidence Consistent. It is responsible for “seeing and proving the current state”, but not for exercising control over EMS, nor for completing the findings of the incident on the alert platform.